Dependencies
What would a change affect?
Follow applications to servers, or suppliers to the customers that depend on them.
VioGraph · Self-hosted graph intelligence
Explore your data as a graph. Trace dependencies, review access and inspect the records behind each finding.
The platform and its graph data run in your environment.
An analyst’s journey
Your environmentSign in
Analyst
Connect data
Map relationships
Choose engine
Build graph
Explore graph
Inspect records
Evidence
SSO · Admin console
Ask AI · Optional01 — What it helps you find
Dependencies
Follow applications to servers, or suppliers to the customers that depend on them.
Access reviews
Follow people and groups to the documents they can access.
Connected records
Find shared identifiers and relationships across records in separate tables.
02 — How it works
Upload files or connect a database, cloud storage or content source.
Define nodes and connections, or import a reusable VioGraph schema.
Choose an administrator-enabled engine and build from a saved copy of the data.
Explore in the UI or query with code. Save findings and watch changes after refresh.
Scroll or swipe horizontally for Infrastructure and Content access. When the examples are focused, use the left and right arrow keys, Home or End. Each product screen can be enlarged.
Showing examples 1 of 2.
Infrastructure · Sample data
Payment Gateway is an application in this sample. Its three servers each link to a rack (server cabinet).
Read the graph from left to right: Application → Servers → Racks
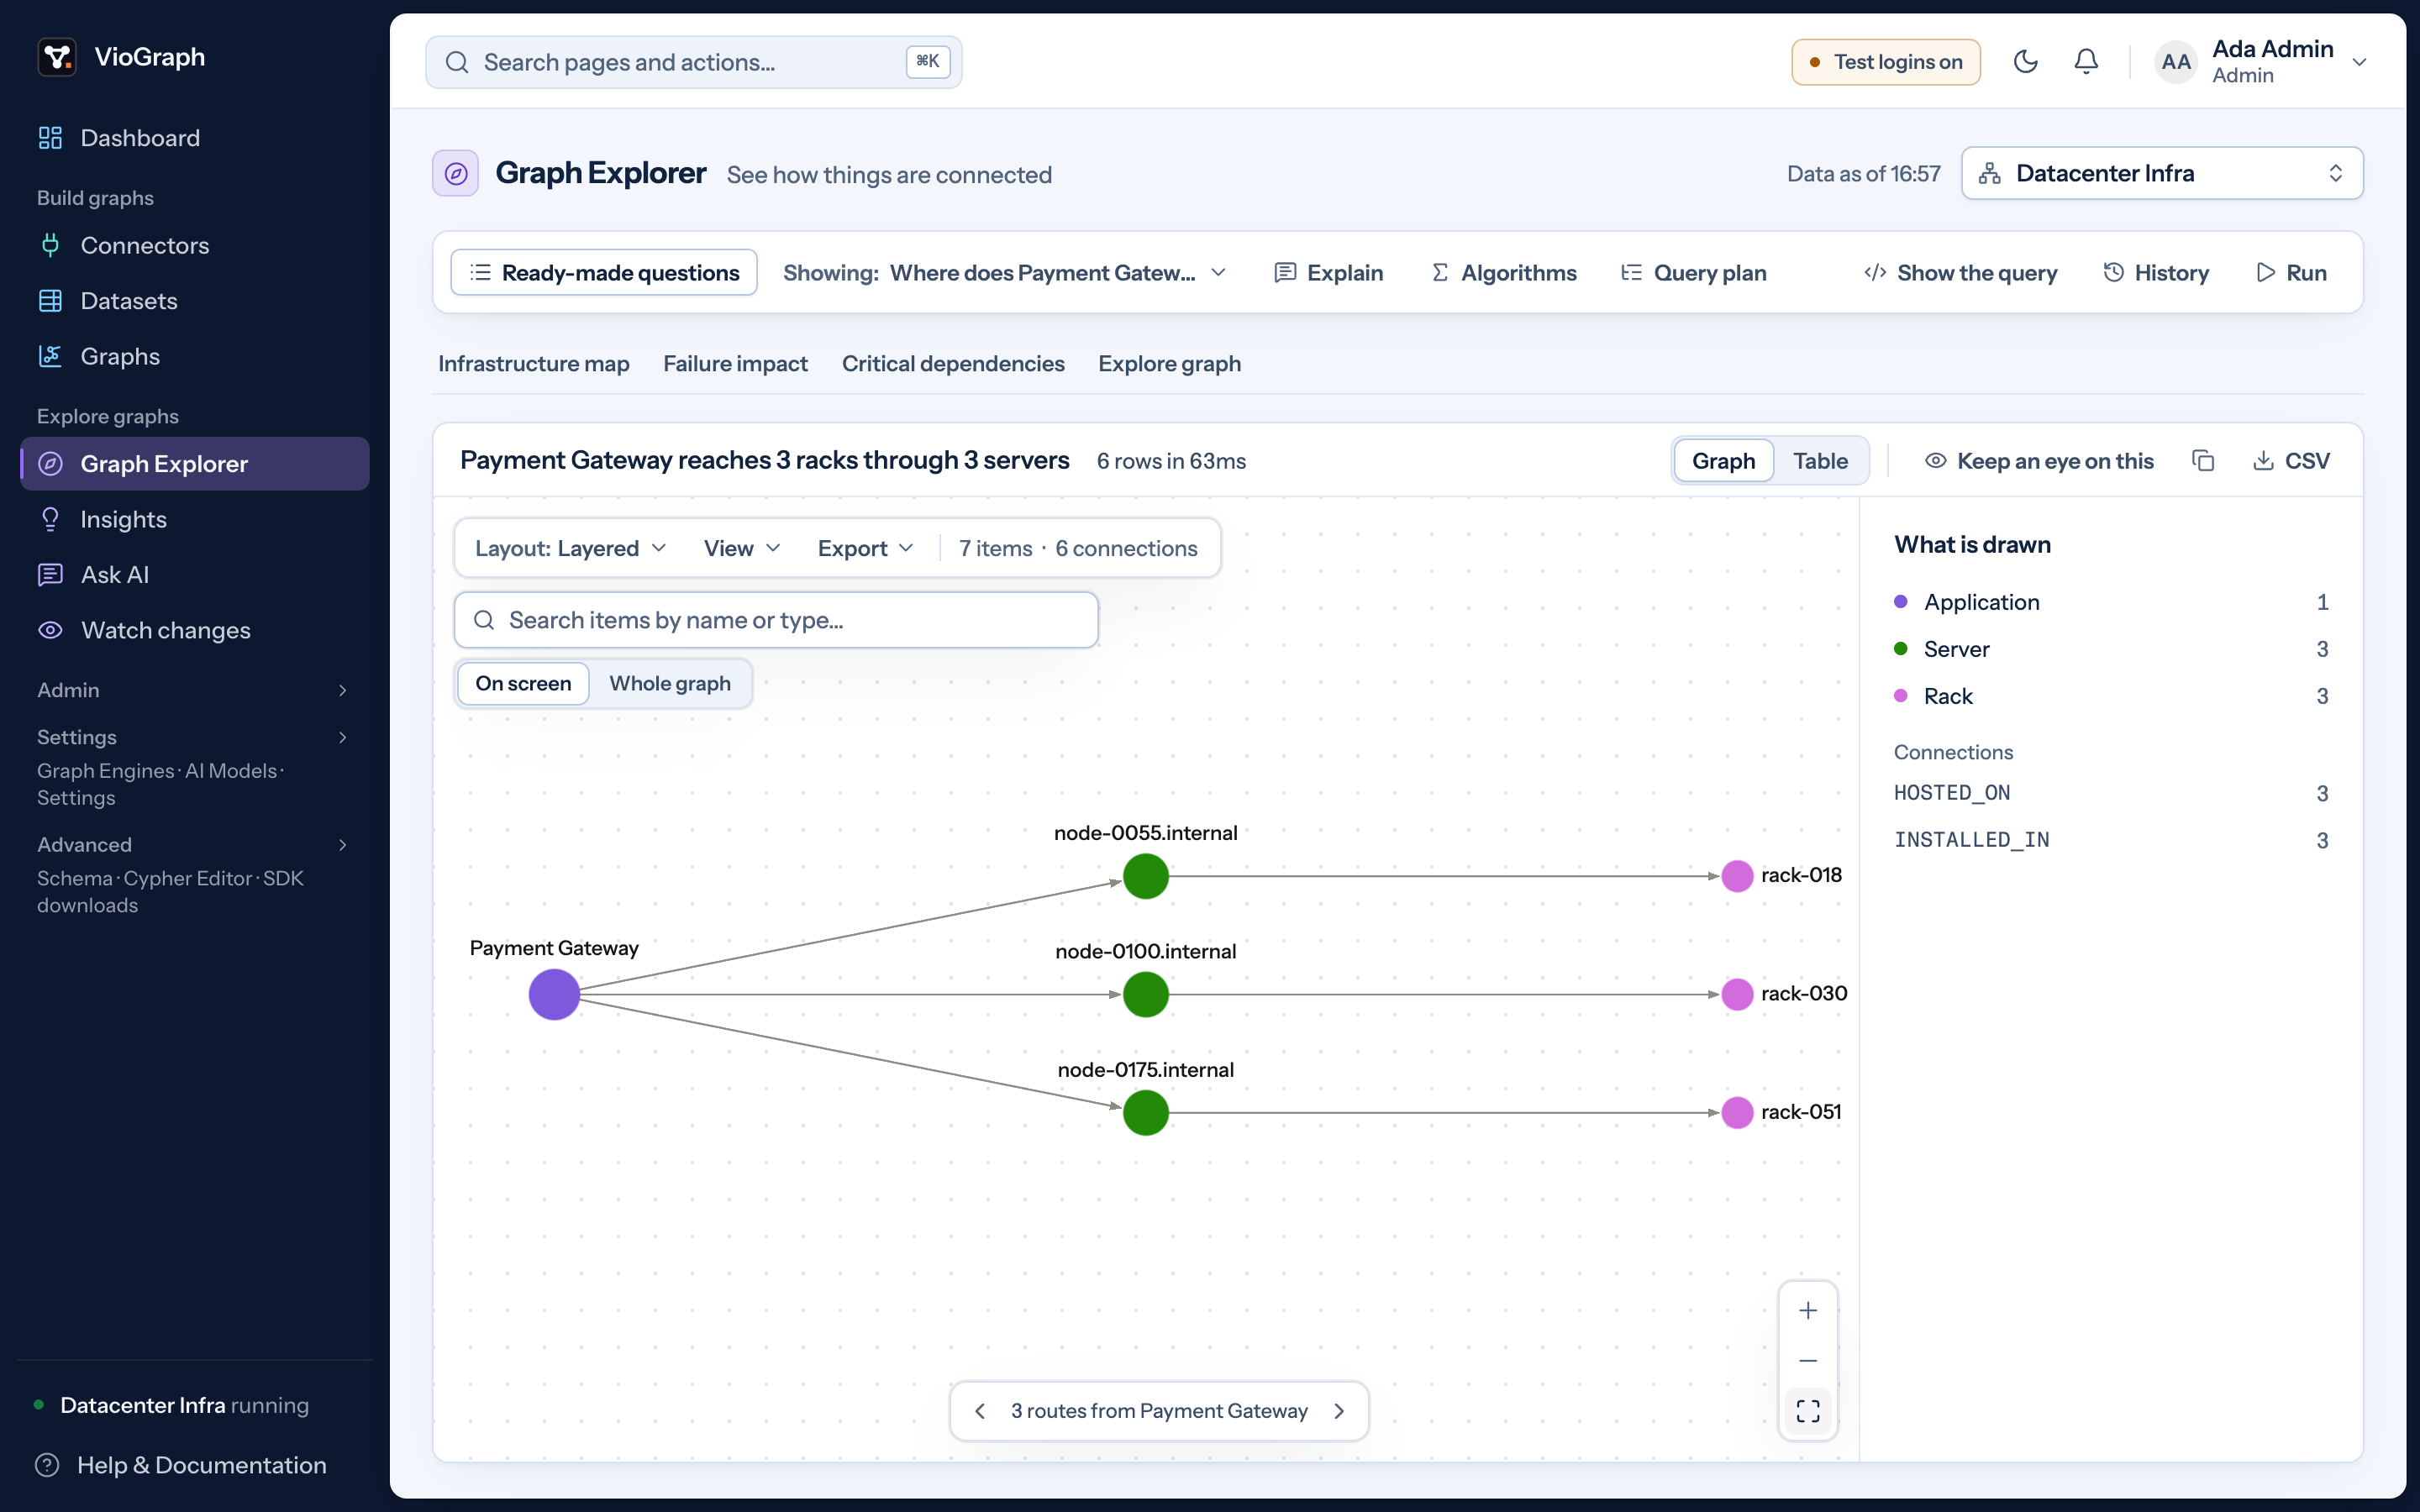
Payment Gateway runs on three servers in three racks in this sample.
Captured in VioGraph Graph Explorer · Sample infrastructure
Content access · Hyland OpenArch
This saved sample links 13 documents in four confidential areas to five reader groups. Site managers have access across all four areas.
Groups → Documents → Folders
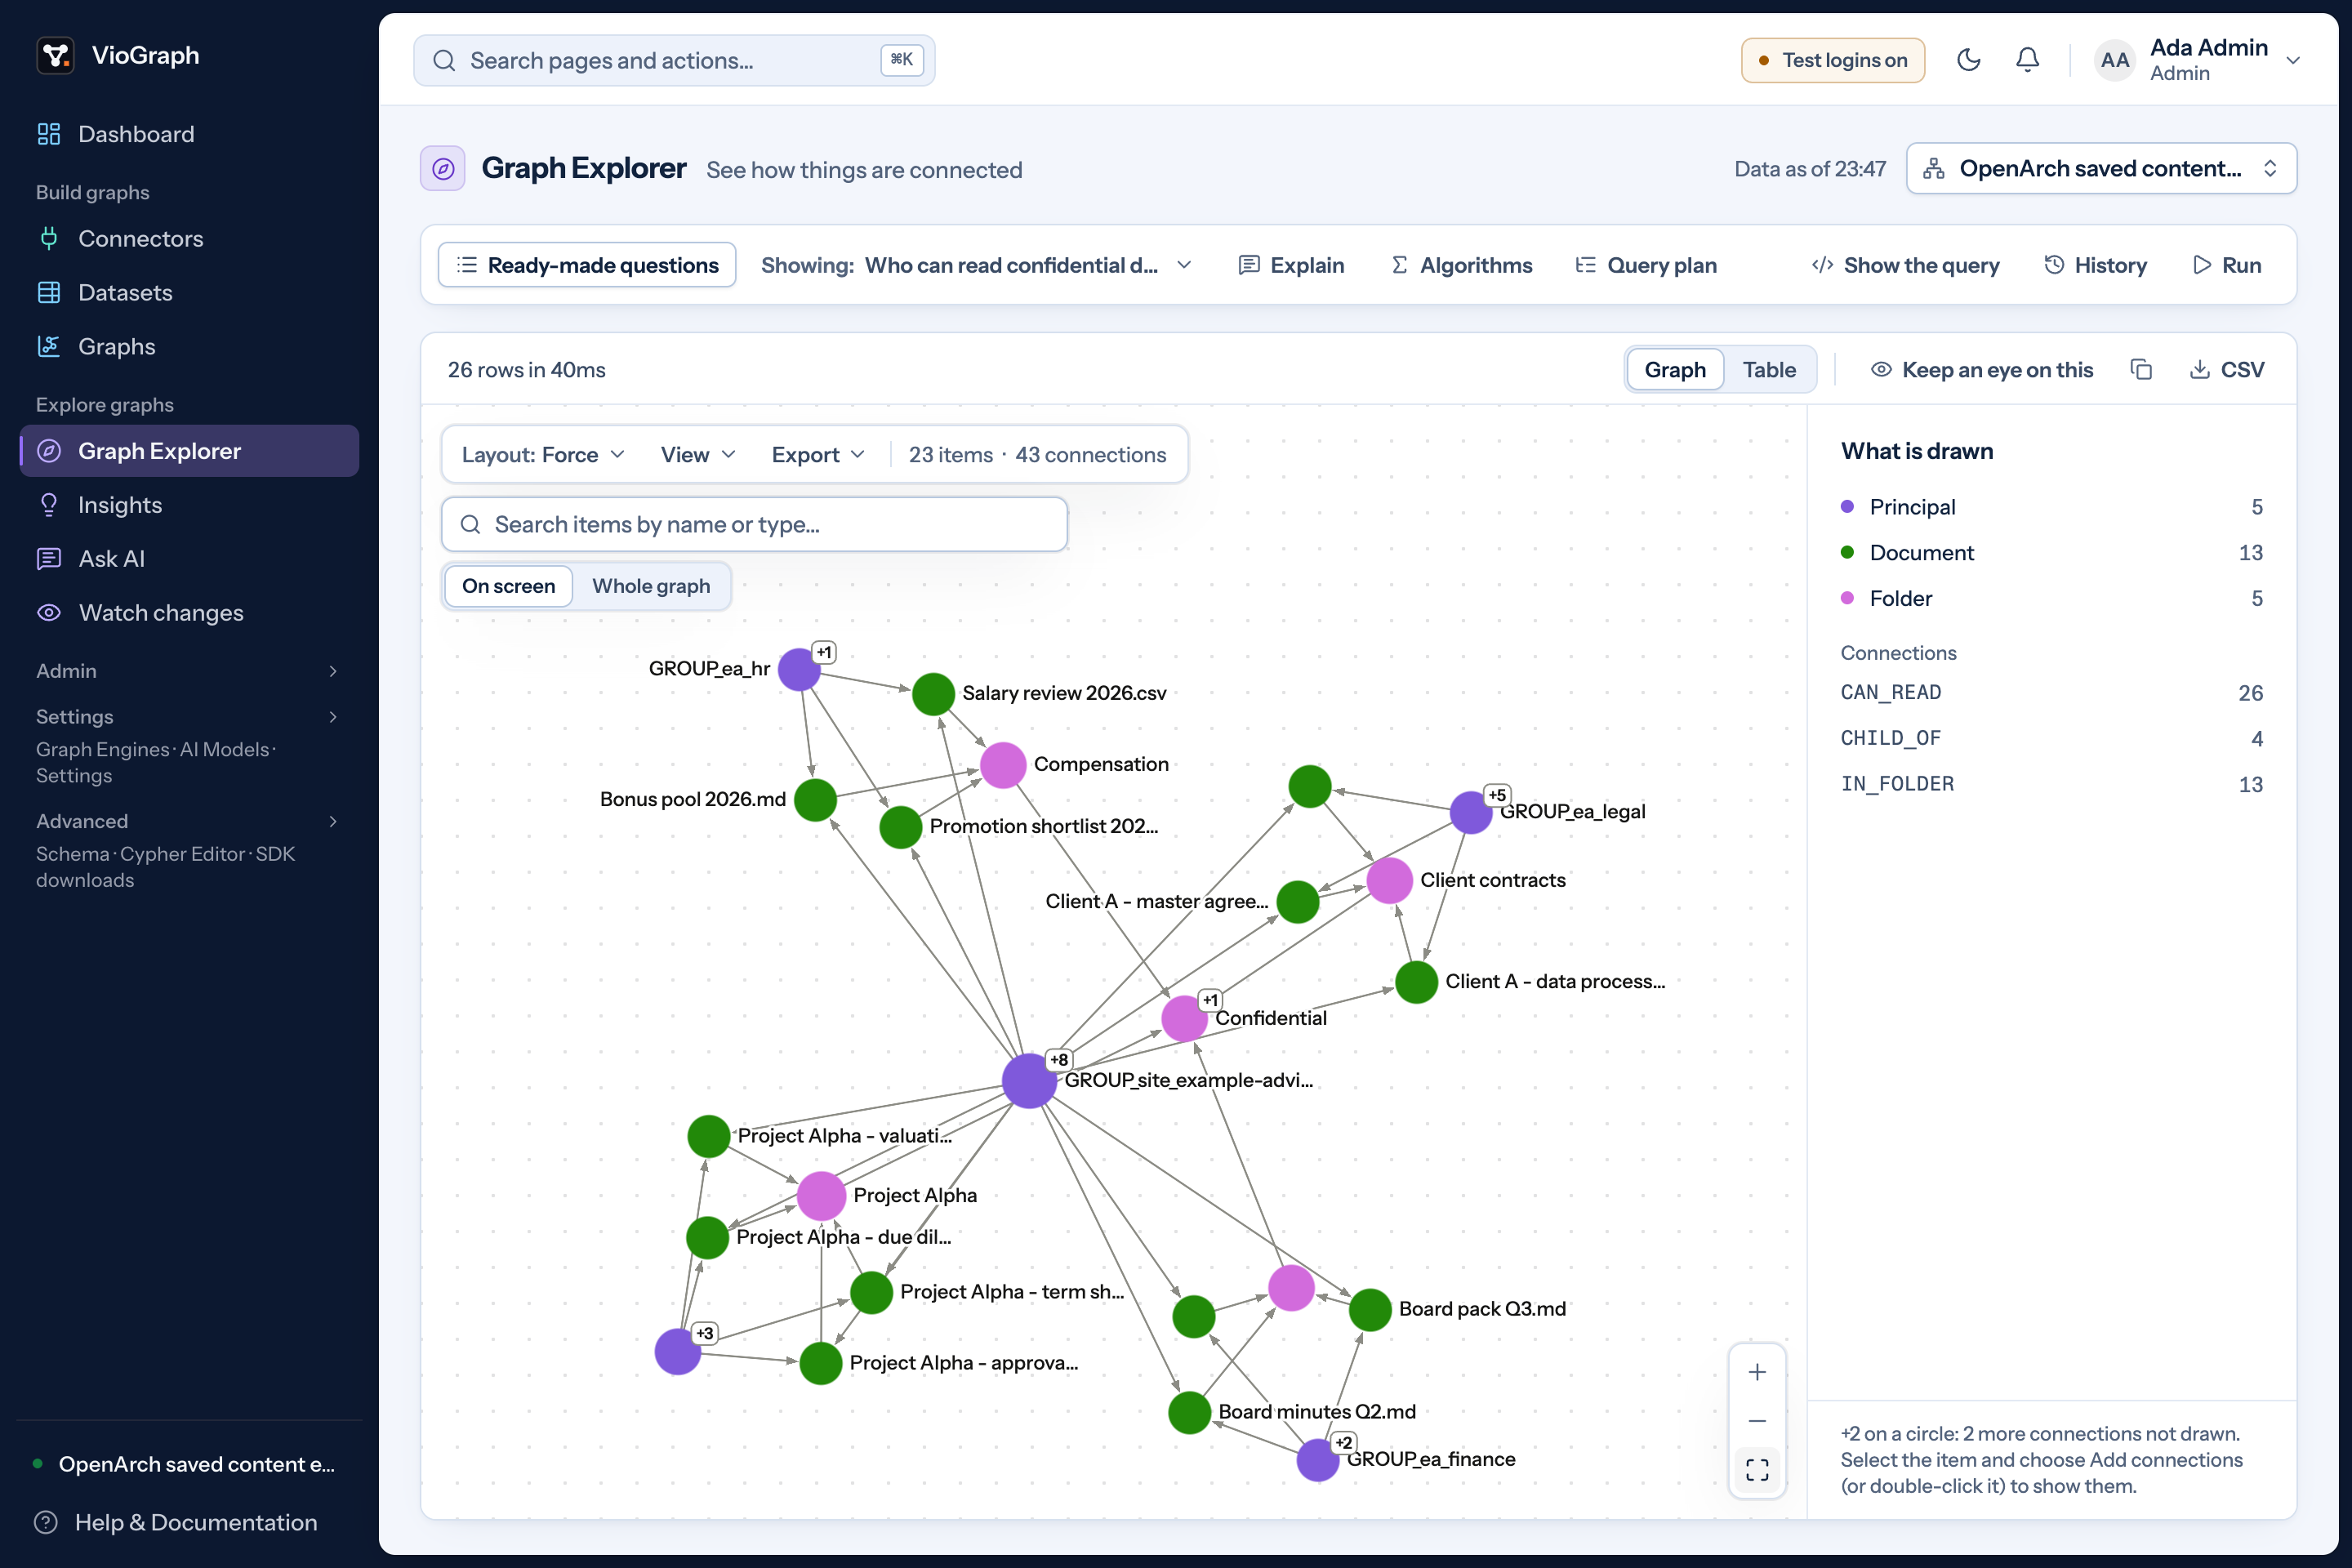
13 documents across four confidential areas, linked to five reader groups.
Hyland OpenArch · Fictional saved export
03 — Product tour
Scroll horizontally to browse. When the gallery is focused, use the left and right arrow keys, Home or End. Each screen can be enlarged.
Showing screens 1 of 4.
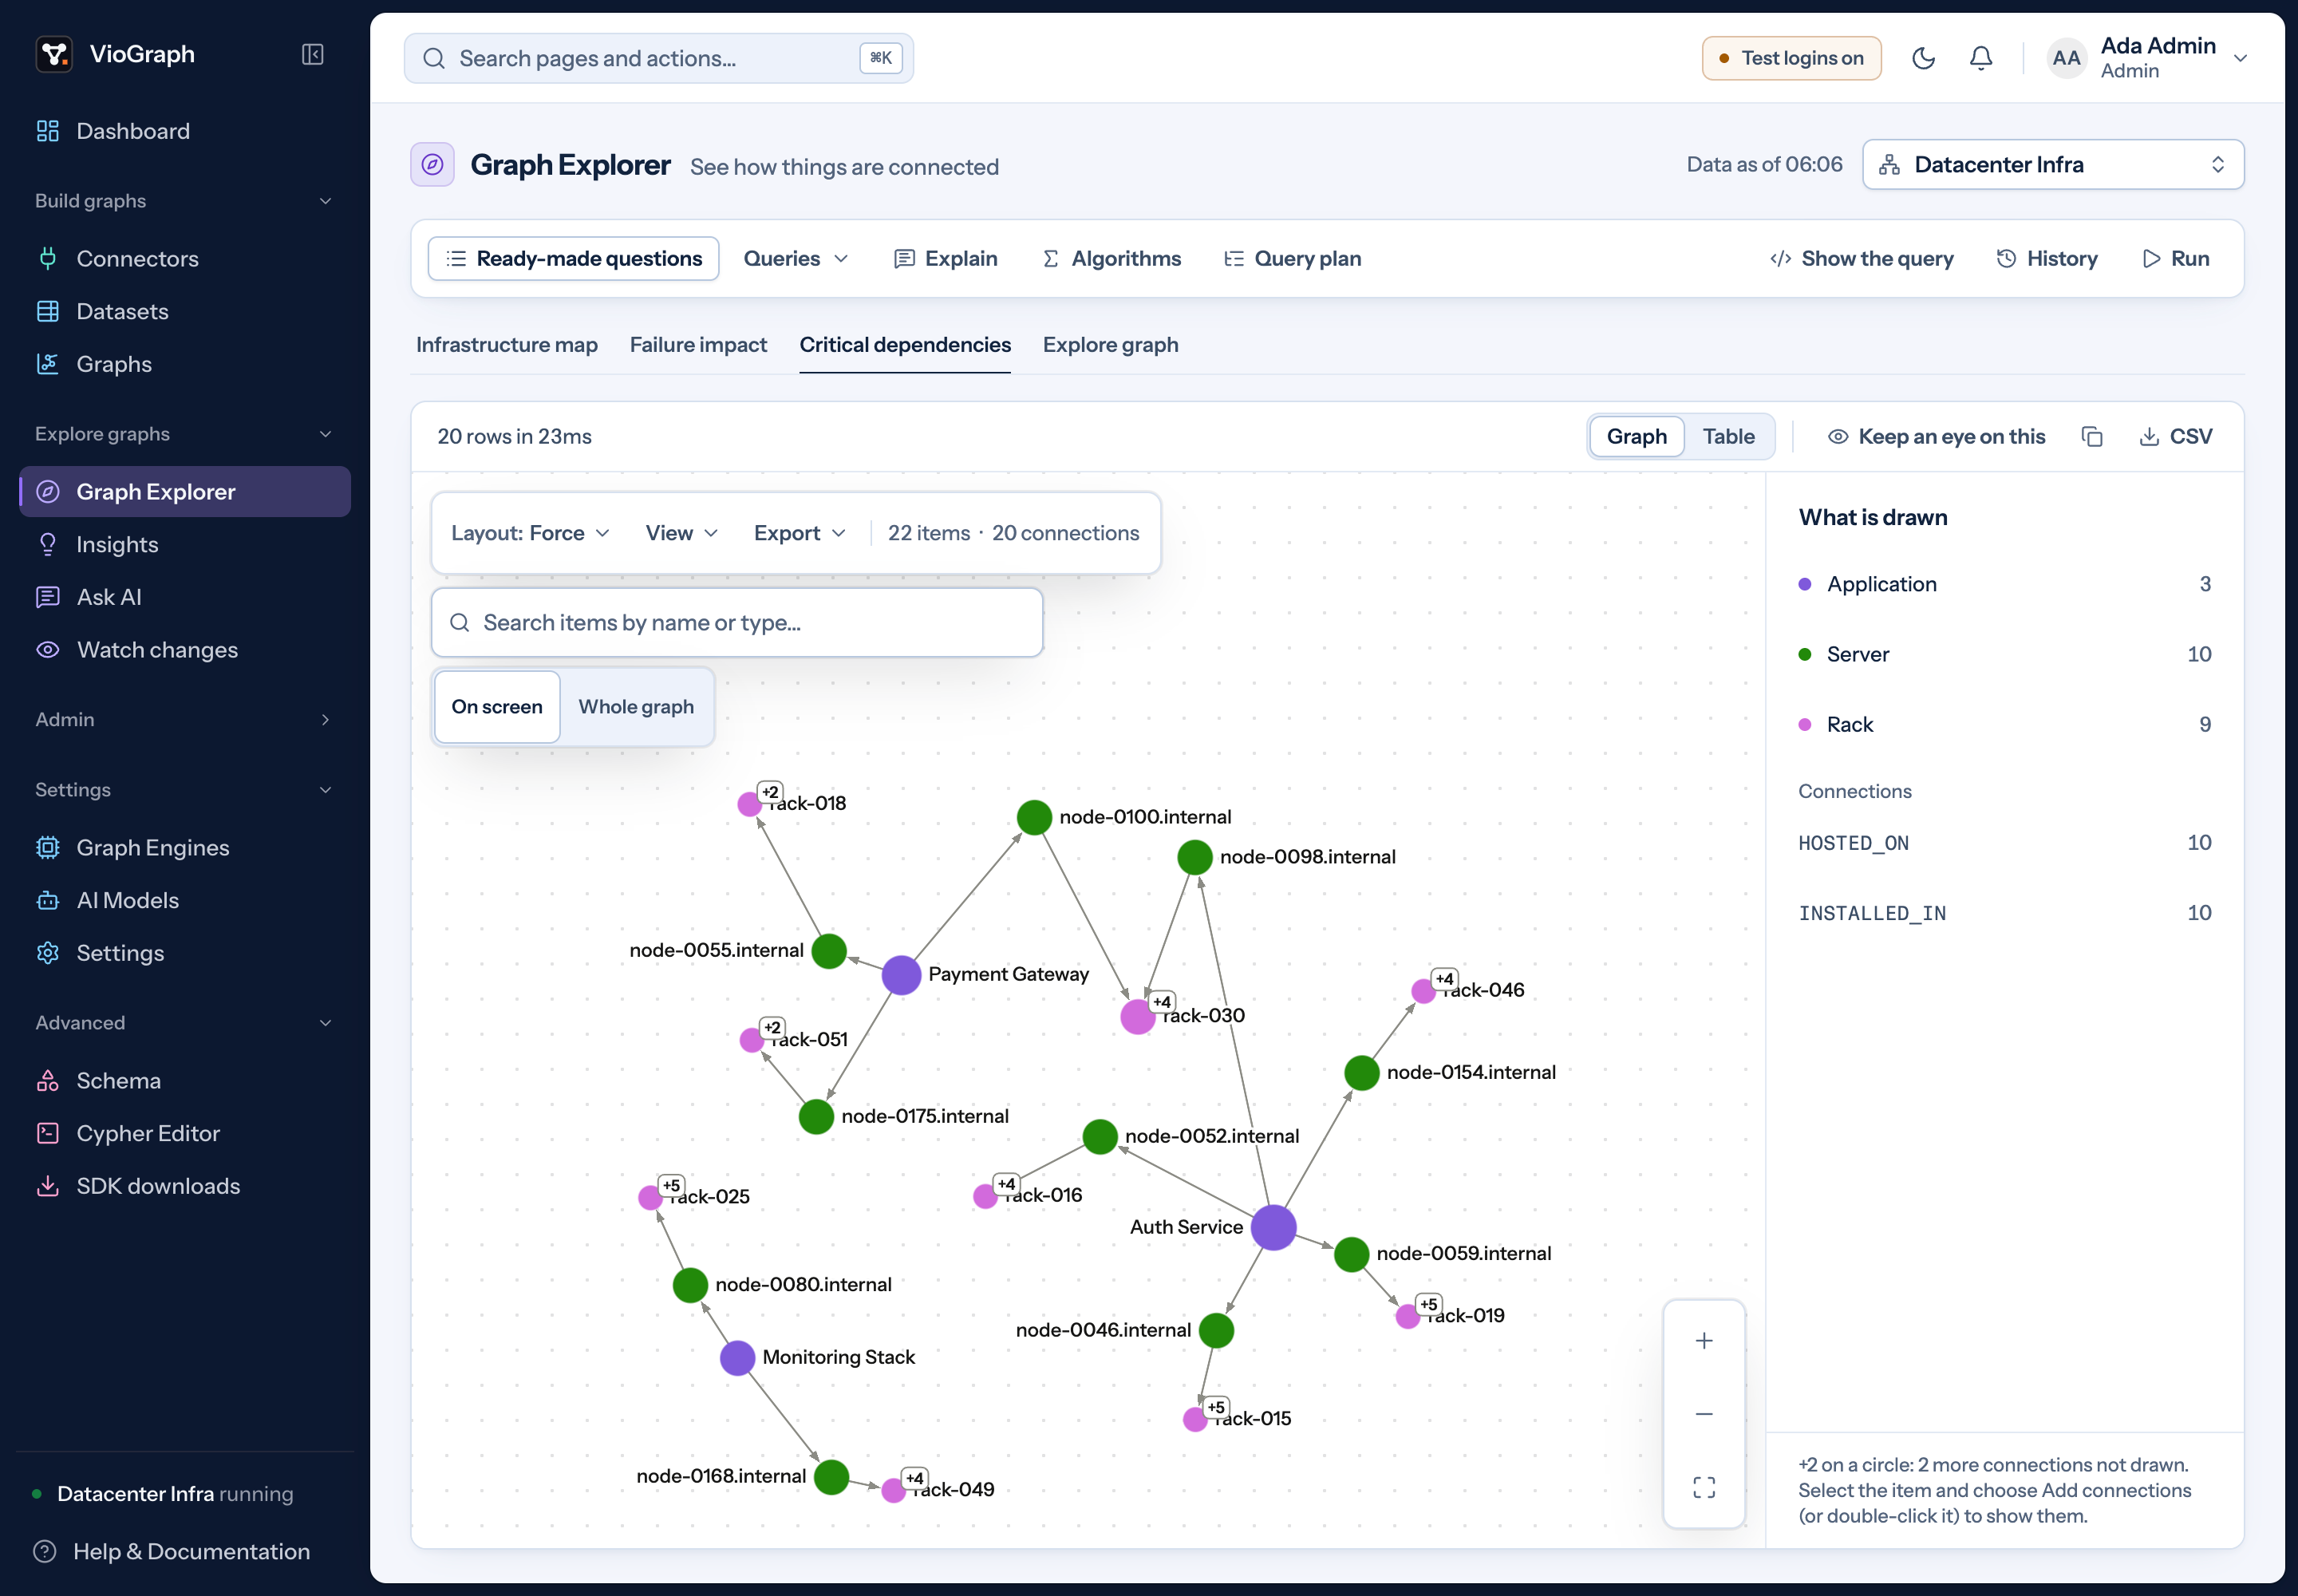
Graph explorer
Follow applications to servers and racks, with the records behind each connection.
Sample infrastructure · 5 November 2026
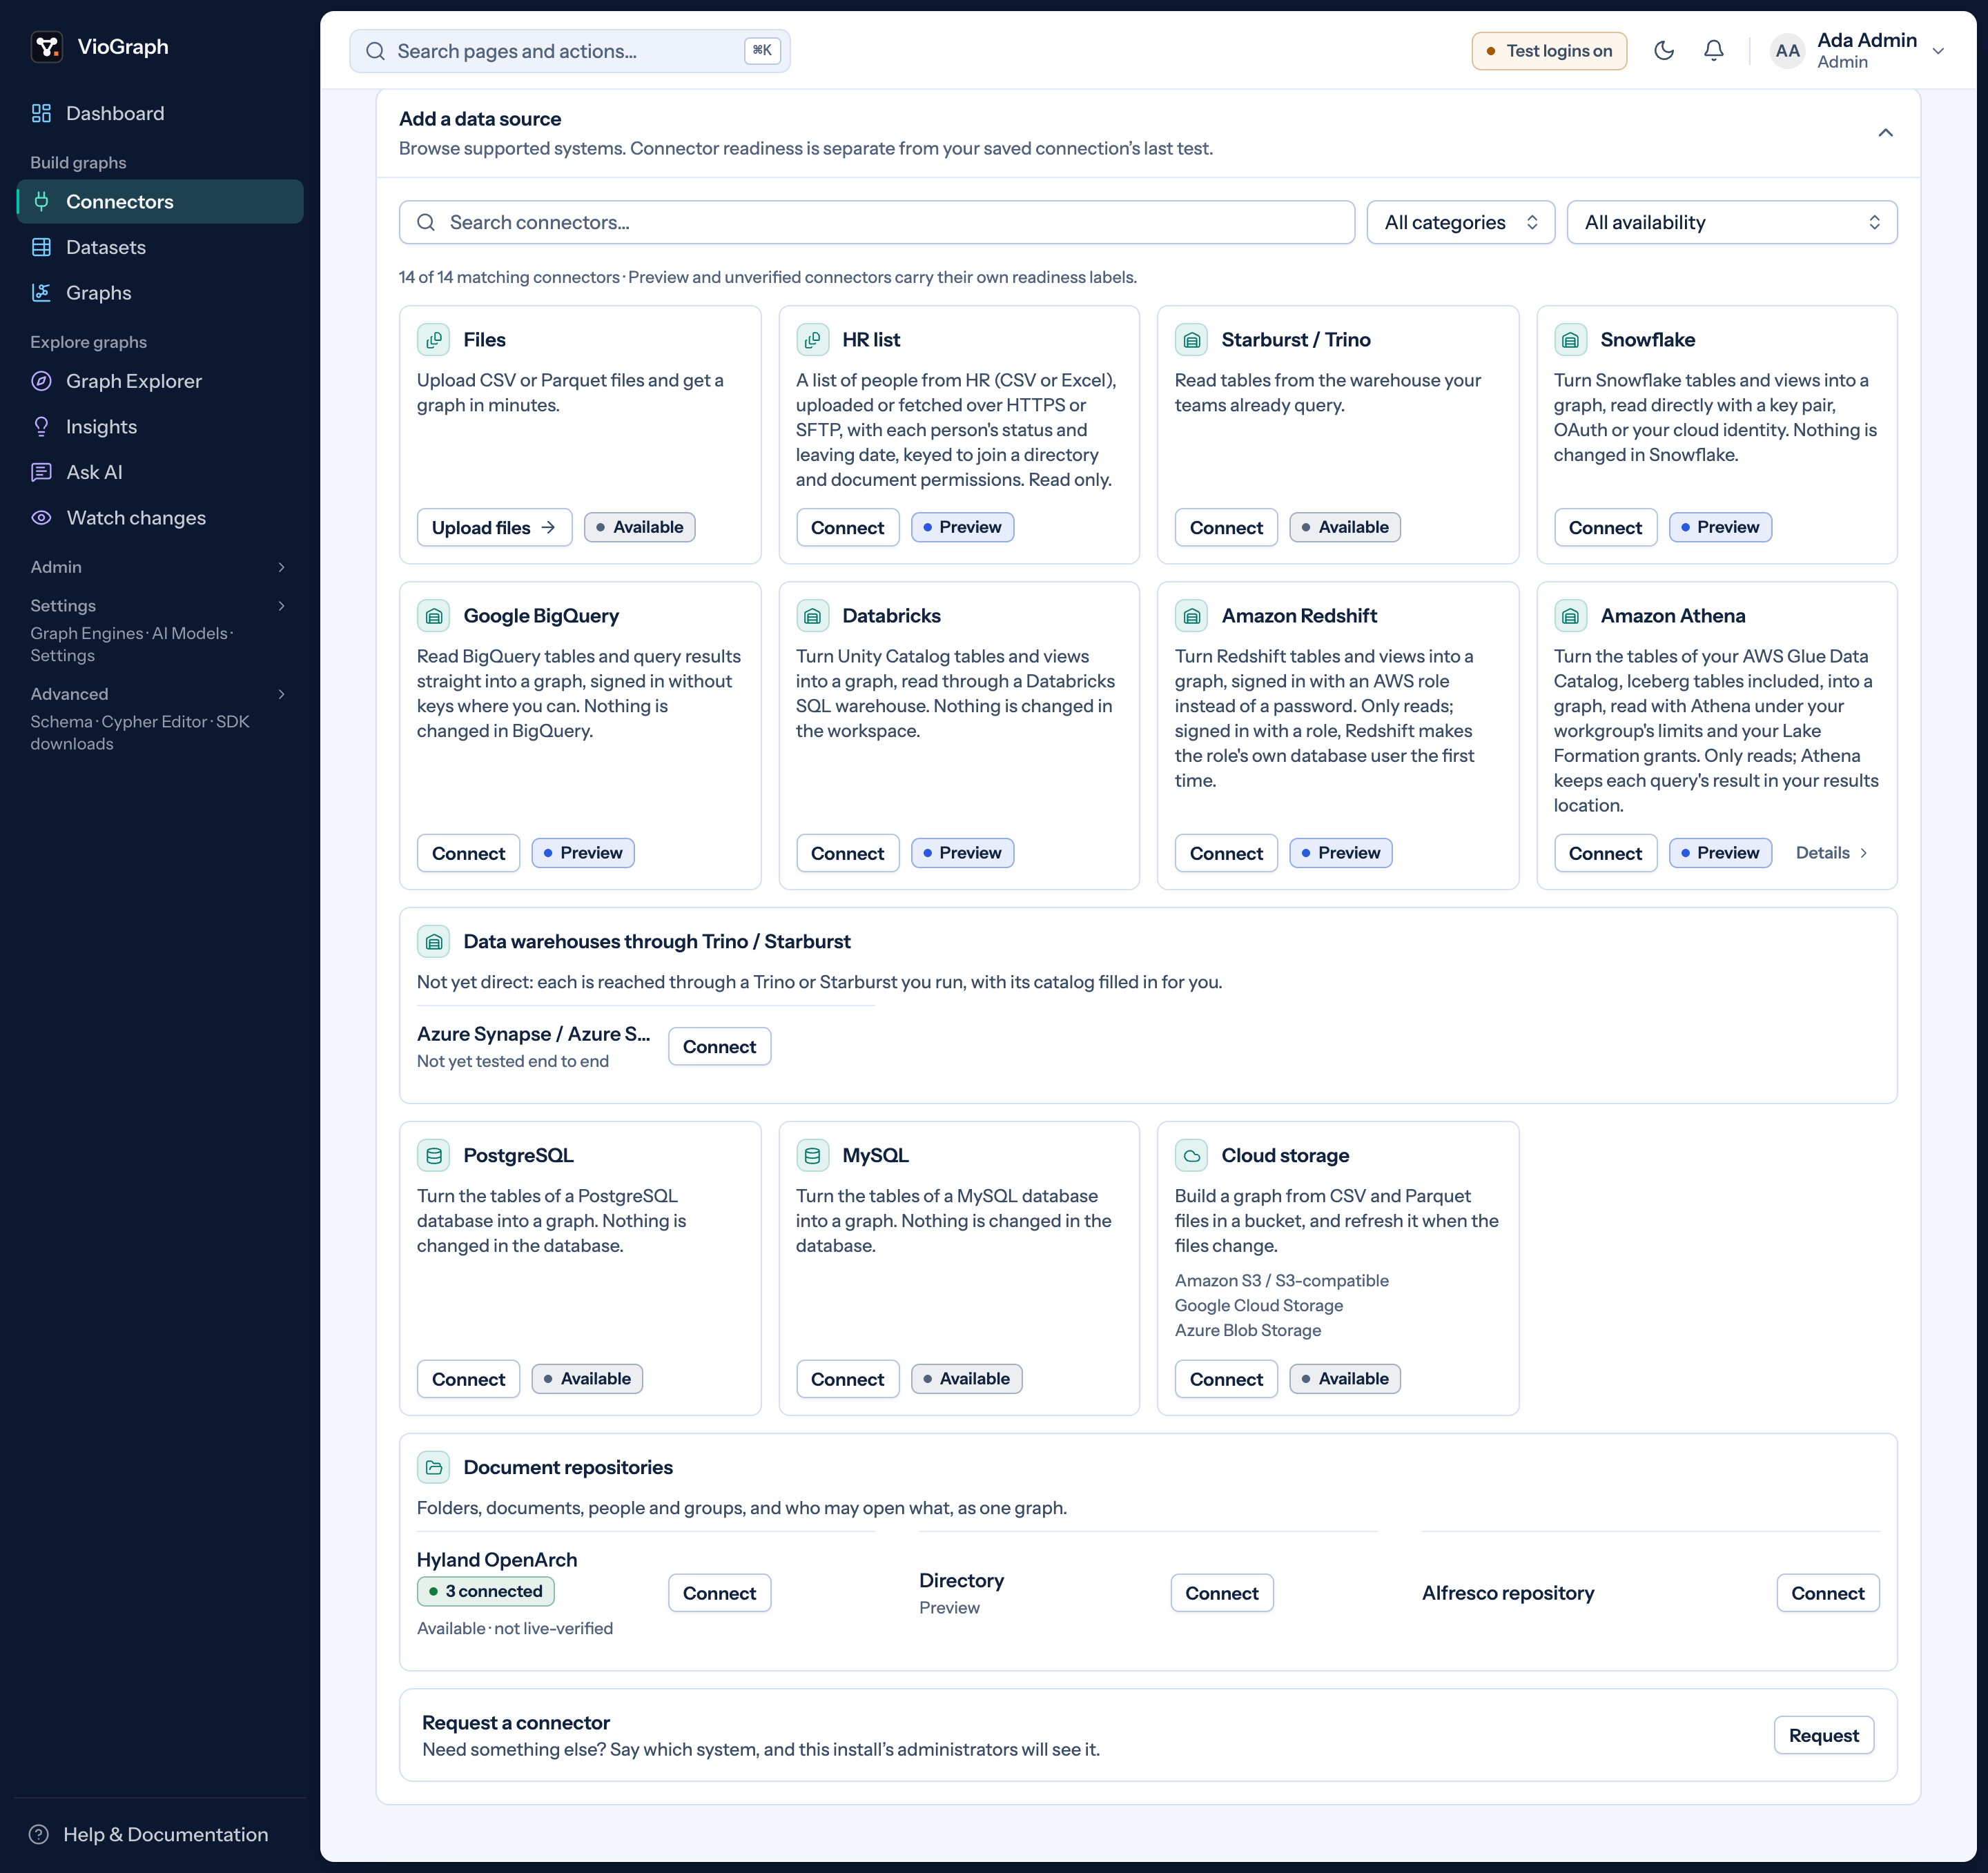
Connectors
Browse 14 catalogue entries, including Hyland OpenArch, with a readiness label for each.
Connector catalogue · 5 November 2026
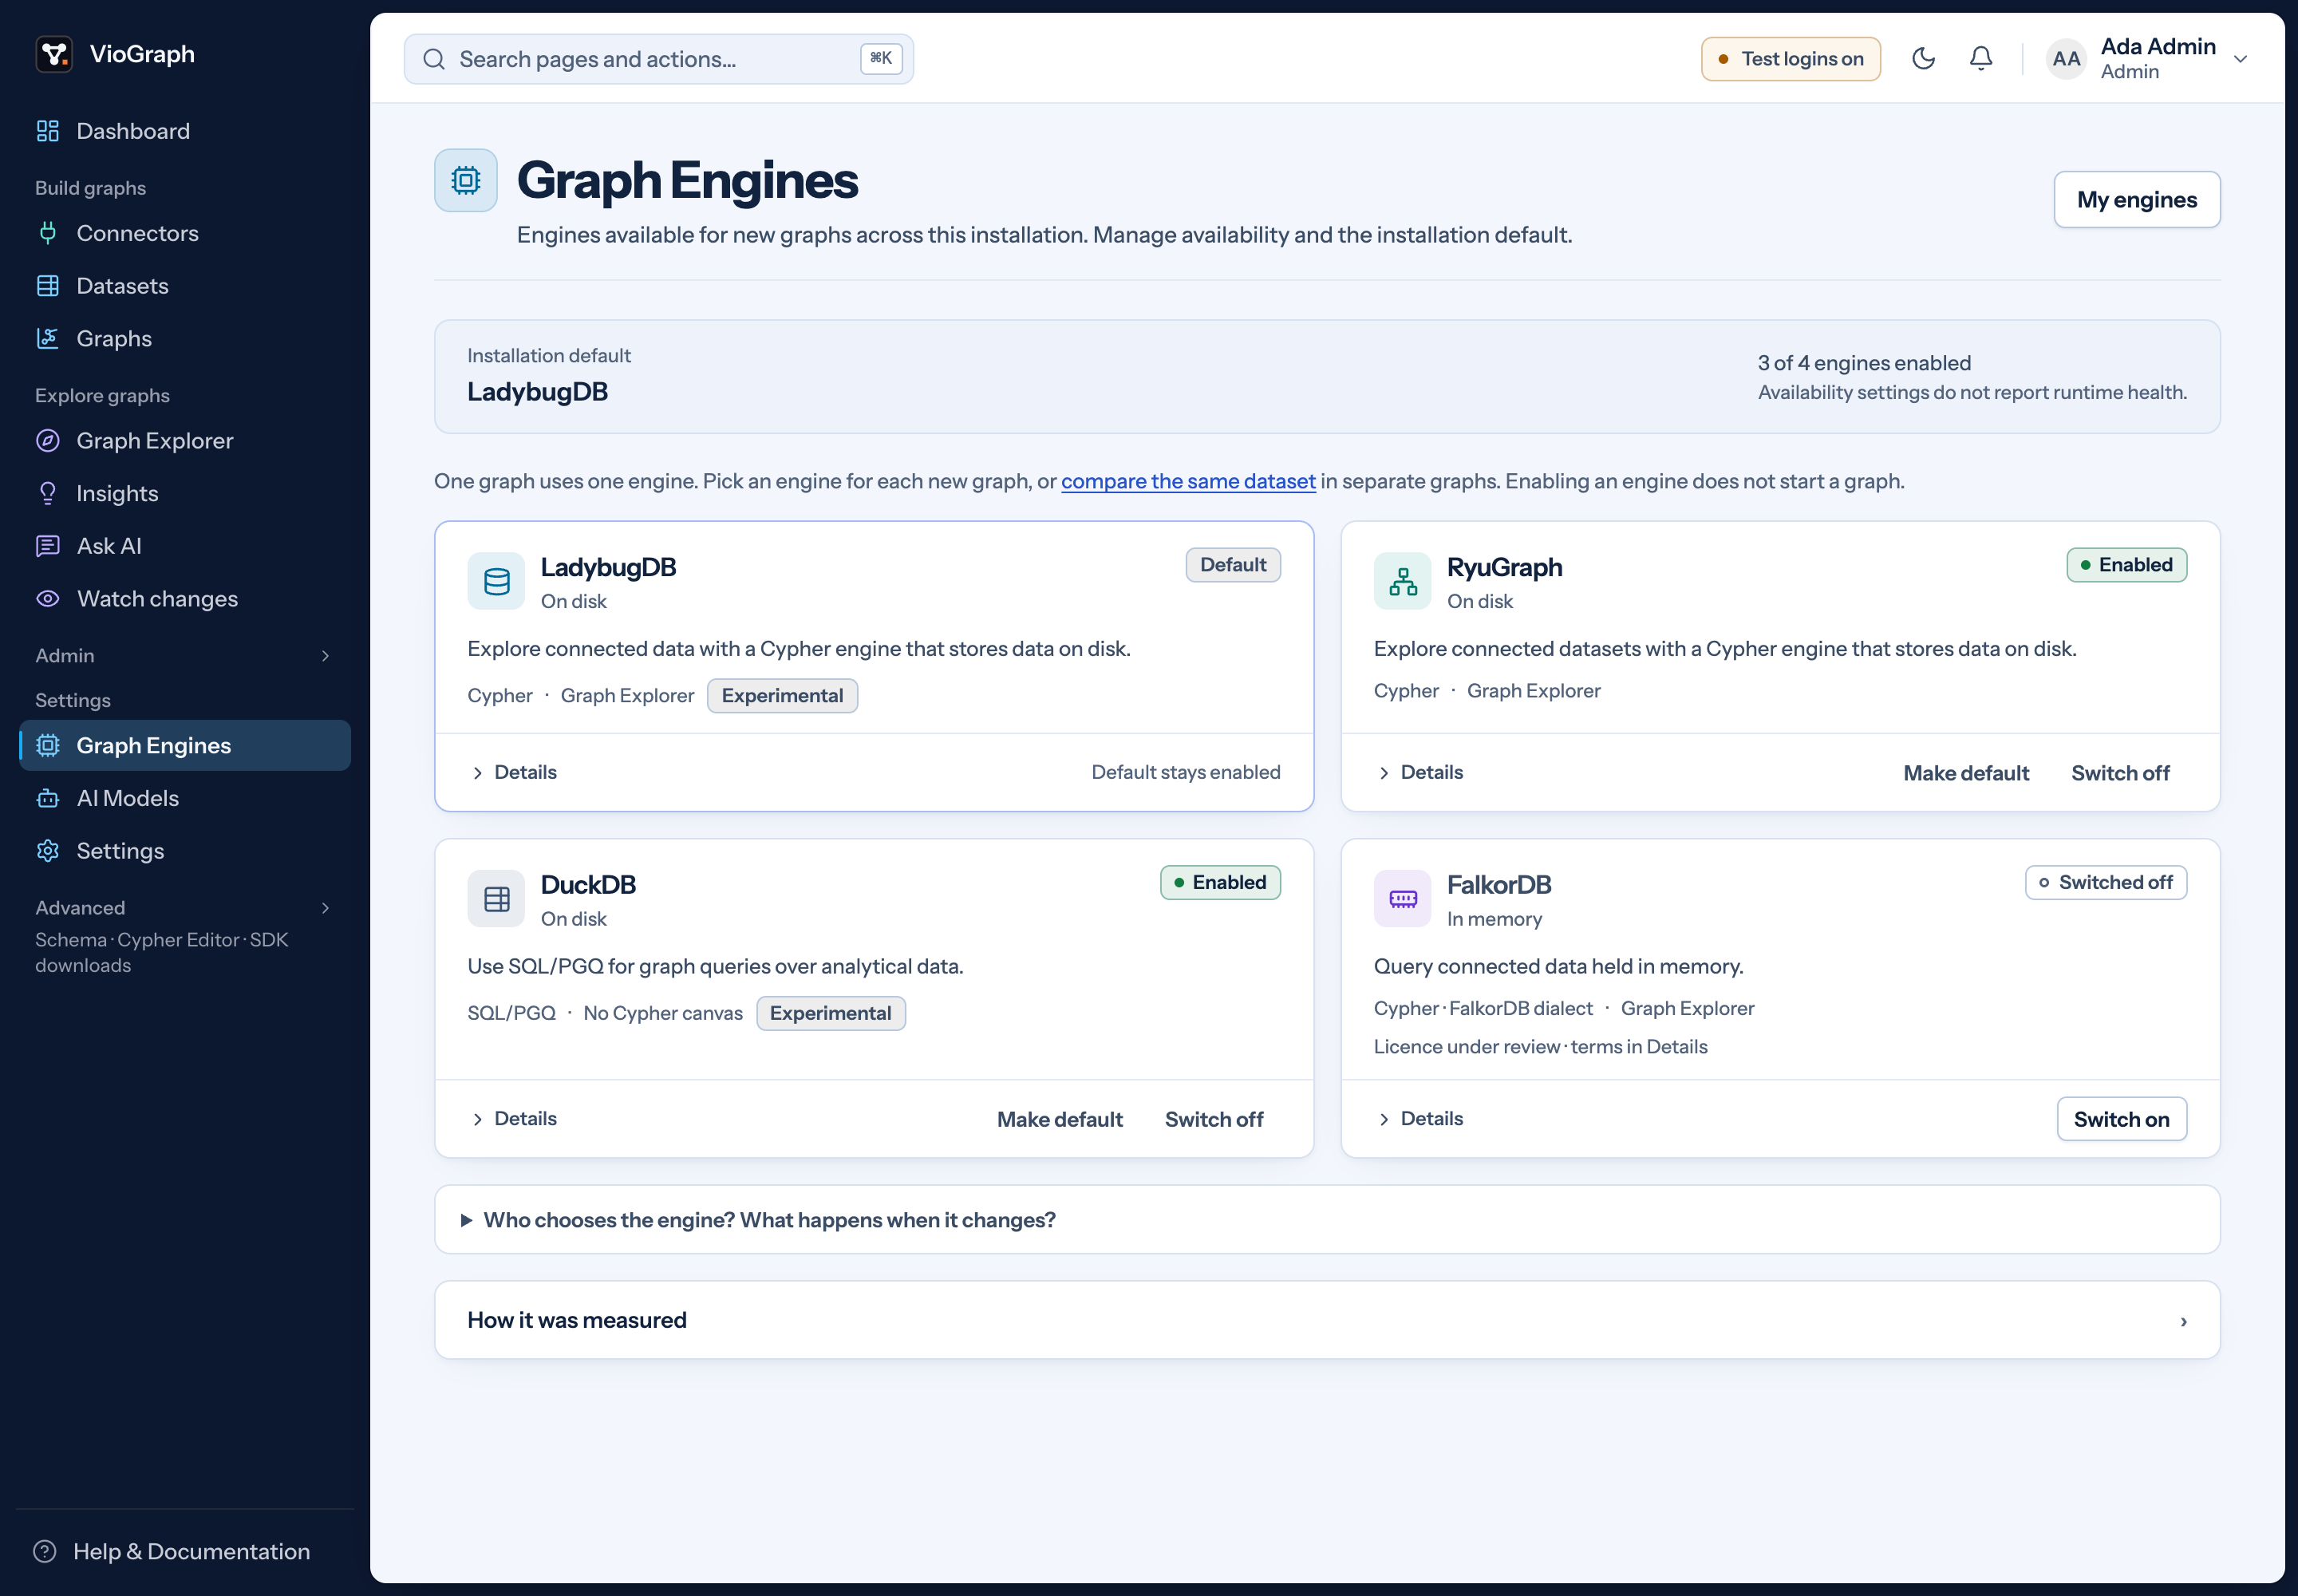
Graph engines
Pick an administrator-enabled engine for each graph.
Installation settings · 5 November 2026
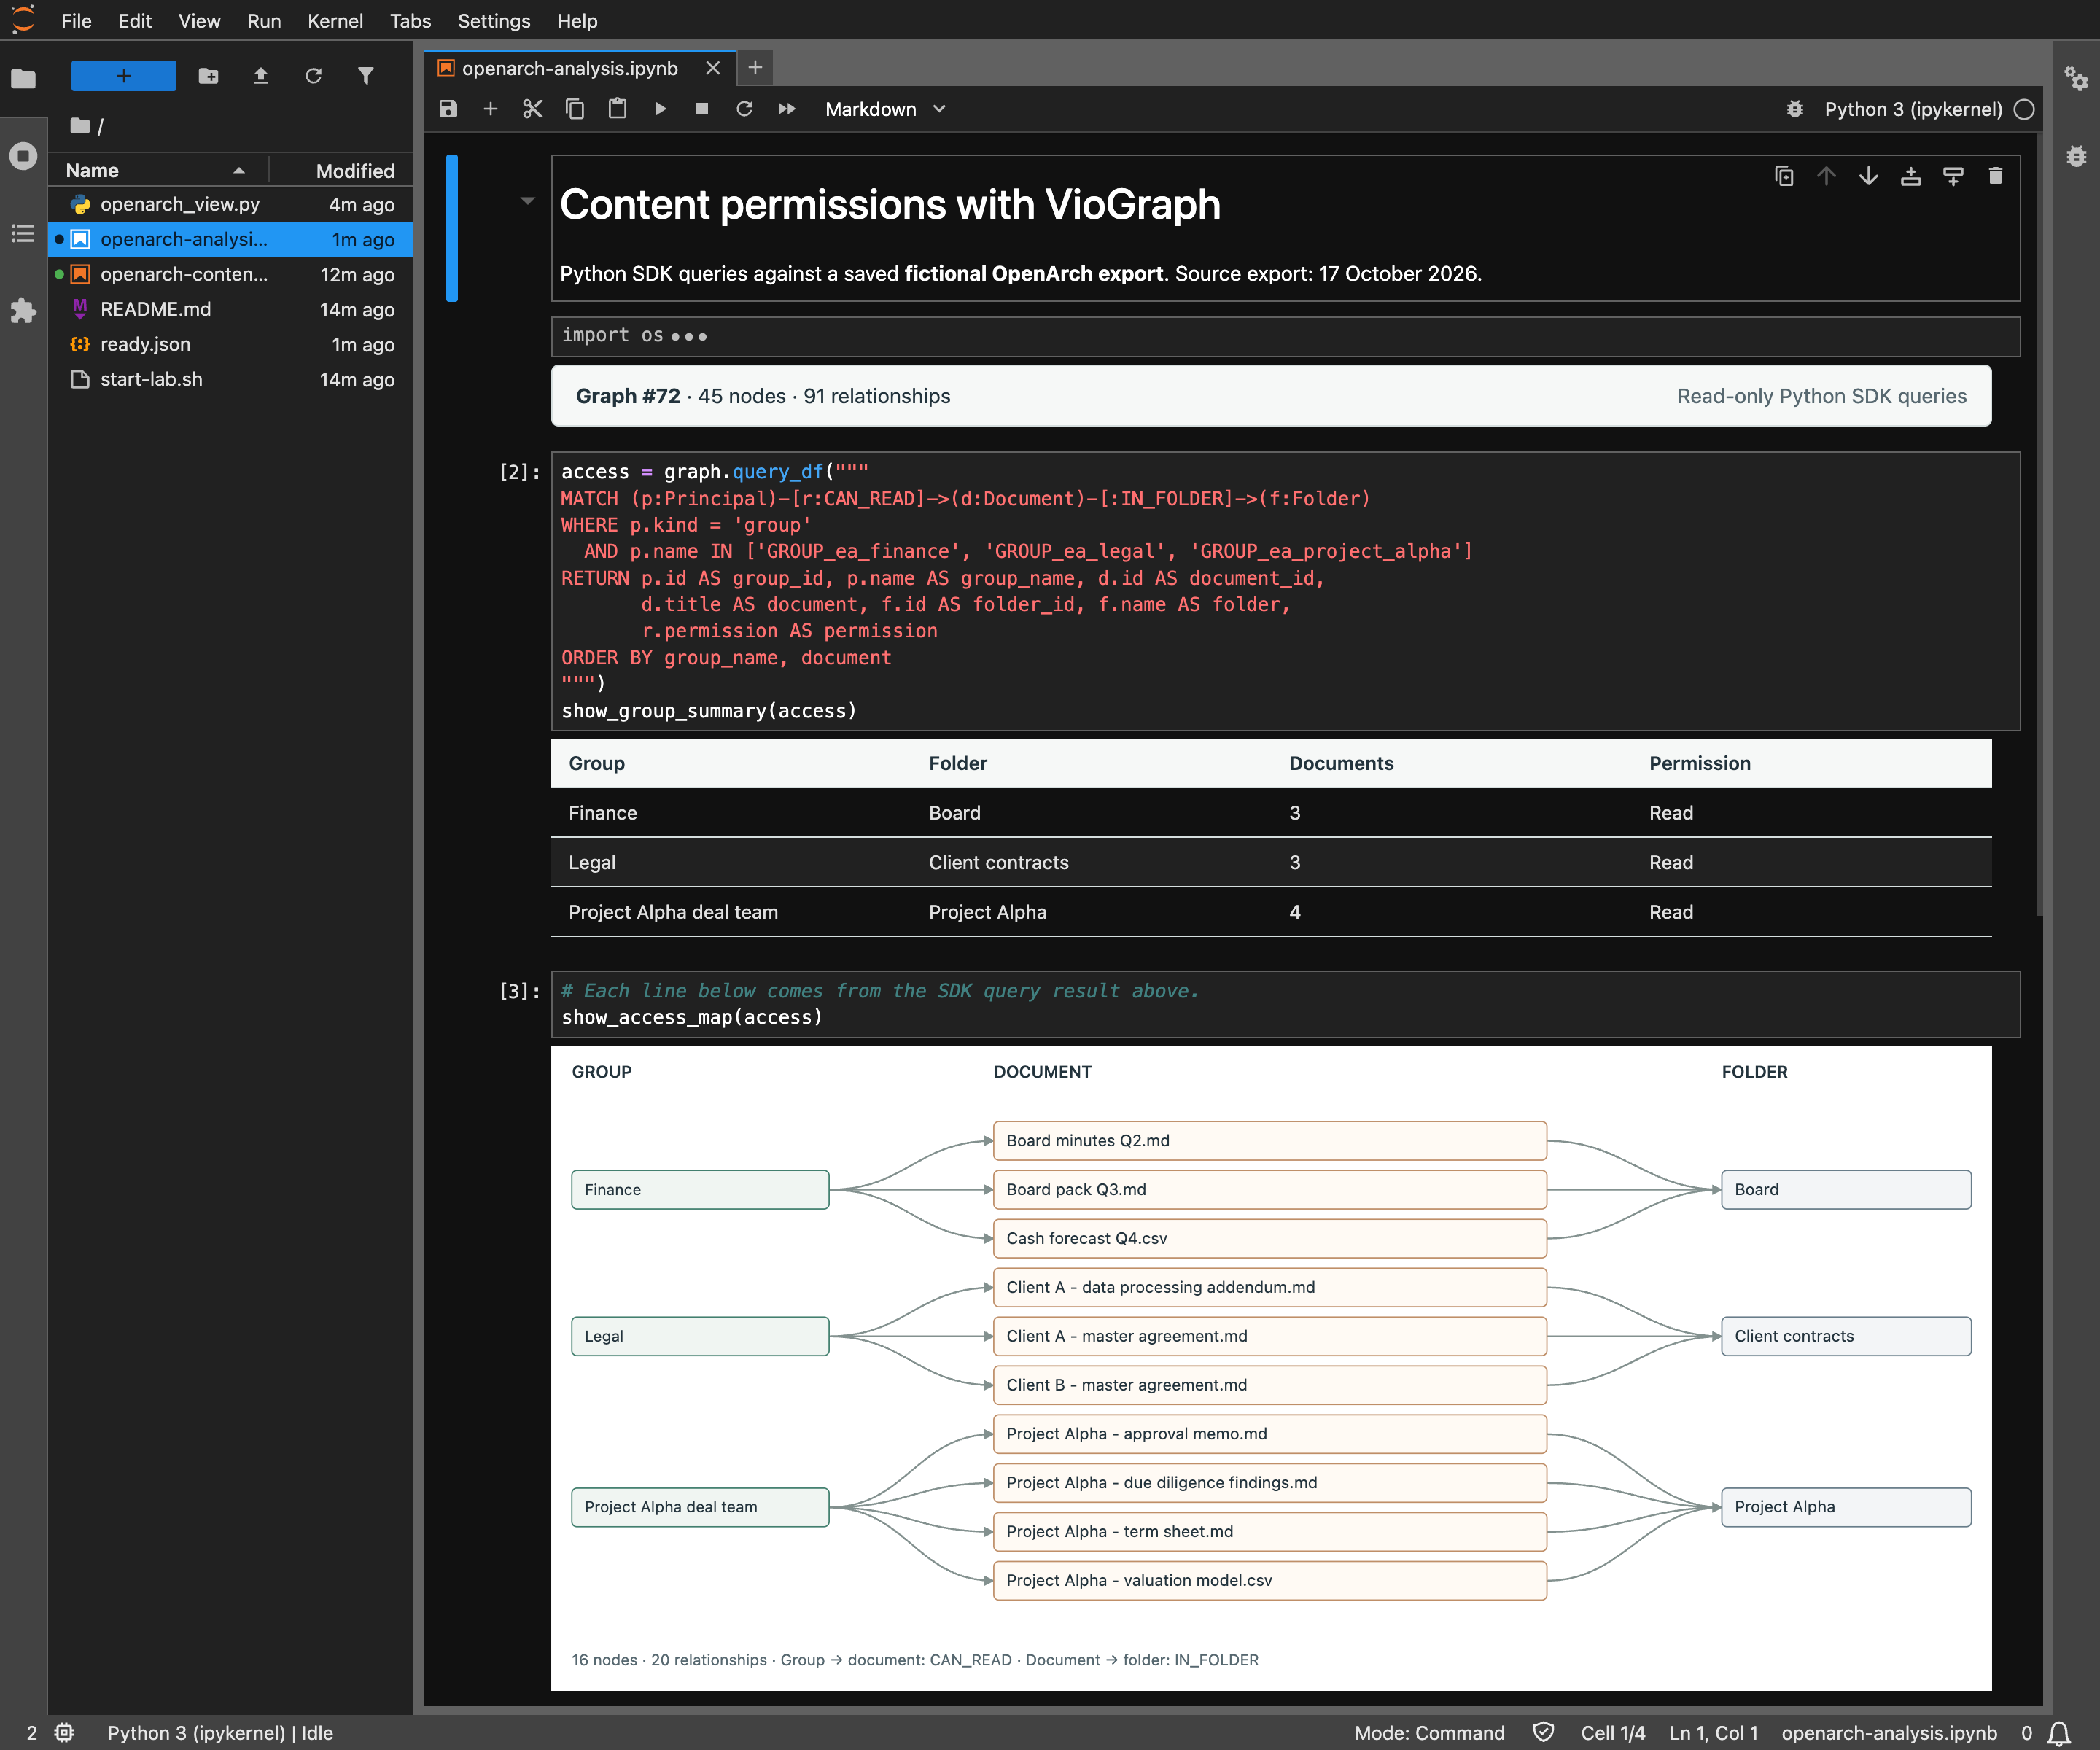
JupyterLab
Use the Python SDK in JupyterLab, or the Java SDK in your applications.
Python example · Sample data · 5 November 2026
04 — Deployment and controls
Run VioGraph and store graph data on your infrastructure, including on premises.
Use the web UI, REST API, Python in JupyterLab, or the Java SDK.
Explore without a model. Enable Ask AI under your administrator’s data policy.
Private evaluation uses Docker Compose and saved copies of source data. Production use requires validation in your environment.
Data and access. Sign in through your identity provider. Control access with roles, workspaces and sharing; configured dataset policies filter and mask data before a person’s graph is built.
AI is a choice. Ask AI is off until an administrator configures it. The installation’s AI policy controls what the model may see. Its queries run with the caller’s graph permissions and are checked to prevent writes. If you configure an external model, data allowed by that policy may be sent to the provider.
Built to inspect. Inspect queries, returned records and the audit log, which includes an integrity check. Answers produced with a model still need review; broader model accuracy has not yet been measured.
Access rules must be configured for each dataset and graph. Recording a permission relationship in the data does not itself restrict who can query that graph.
Docker Compose is the current install path. Kubernetes, ECS and cloud deployment paths are experimental. VioGraph has been run on developer machines. A private evaluation validates the requirements for your environment before production use.
Choose one engine per graph, or build the same dataset on different engines to compare results. RyuGraph and FalkorDB are supported within the documented tests and measured limits. LadybugDB, the default, and DuckDB are experimental. DuckDB uses SQL/PGQ and does not support Ask AI. FalkorDB is optional, off by default and has a separate source-available licence.
05 — Private evaluation
Agree the question, scope and success criteria before sharing data.
Choose the question, data sources and access requirements together.
Review sample data, then evaluate a representative dataset.
Check the answers, refresh process and operating requirements.